
Small Business Growth Strategies: Build Scalable Systems
Exclusive small business growth strategies for companies with $10M+ revenue. Discover actionable steps to achieve sustainable success and scalability.
July 20, 2026

Congratulations. You’re in the slim minority of US businesses that have hit $5 million in annual gross revenue or more. But to reach $10 million and beyond, you’ll need new small business growth strategies.
Market research from Inc. and the Kauffman Foundation found that two-thirds of fast-growing companies eventually regress, stall, or fail.
The reasons for failure at this level are different from early-stage startups and new businesses.
Companies that create sustainable growth at scale do three things:
- Validate their competitive position quarterly.
- Build operations that can handle three times the volume without breaking.
- Instead of vanity metrics, track the specific key performance indicators (KPIs) that determine brand value.
In the rest of this post, we’ll explore small business growth strategies that will enable you to scale without destroying what you’ve built.
But first, let’s explore why your organization is at a critical juncture in its business journey.
Why you need to define a business growth strategy at the $5 million threshold
The $5 million annual revenue mark represents a fundamental shift in how your business operates. Here are a few reasons why:
- You’re too big to be ignored. More competitors are finding out about you and taking steps to steal your market share.
- Larger competitors can outspend you. They have bigger budgets for advertising, marketing, and service.
- Smaller competitors target your customers with aggressive pricing or feature matching.
- You need to expand into new markets for sustainable growth because you’re outgrowing your current market.
Working capital needs also increase exponentially with revenue. As you move to broader markets, customer acquisition costs (CAC) rise. Investments become necessary for better internal systems, processes, and management.
What you could once spend to get by now requires significant capital.
These three shifts explain why two-thirds of fast-growing small businesses stall out at the $10 million stage. The business really needs a scaling strategy, but continues to operate using the same startup tactics.
The companies that break through the barrier recognize these changes early and adapt their approach.
How small business growth strategies differ from early-stage growth
What got your business to this point won’t take it much further.
Early-stage growth focuses on product-market fit, maximizing growth rate at any cost, building your initial customer base, and developing core offerings.
You win through execution. You win by working harder, moving faster, and being more responsive than competitors.
At $5 million annual revenue mark, the focus shifts. You must defend your market position against well-funded competitors, build operations that scale without breaking, manage margin pressure as acquisition costs rise, create long-term competitive advantages, and develop expansion revenue from existing customers.
The key difference is that early-stage companies can succeed through execution alone.
You need small business growth strategies that don’t depend on perfect execution every time. Long-term success comes when you have better systems, clearer positioning, stronger processes, and more defensible moats—not just harder work.

Warning signs of looming growth challenges
Most growth problems reveal themselves through early indicators, 6-12 months before they show up in revenue. If you catch them early, you have time to adapt. If you miss them, you could end up managing a crisis.
Let’s now look at some of these potential problems.
Sales efficiency declines. Sales cycles lengthen by more than 20%. Acquisition costs rise faster than the lifetime value of customer relationships. Win rates drop against both larger and smaller competitors. These patterns signal weakening differentiation or market positioning drift.
Operational stress occurs. Customer complaints about inconsistency increase. Employee turnover rises in key positions. “Emergency” fixes become more routine. Quality issues appear in your core offerings. These issues indicate your processes can’t handle the current volume, let alone growth.
Market position erosion occurs when competitors successfully copy your differentiation. Price pressure comes from multiple directions. Gross margins decline despite revenue growth. You lose “automatic” consideration in sales processes. Your competitive moat is filling in.
Team scaling issues arise. Key employees start to burn out. You struggle to hire people at previous salaries. Coordination costs rise. Internal meetings multiply. These are signs that your organizational structure has outgrown your management capability.
Many small businesses start seeing these problems appear months before they damage the bottom line. If you’re seeing two or more of these patterns simultaneously, you’re operating on borrowed time.
This guide can help your business address each of these challenges systematically with the strategies in it.
Start with a strategic brand audit
Businesses with annual revenues of $5 million or more must change the way they compete.
New businesses have room for growth in their initial market. But over time, it becomes tougher to grow because of market saturation. In other words, you’ve tapped out your existing segments.
In the early stages, small businesses primarily compete on execution. You attract new customers because you’re faster, cheaper, or more attentive than alternatives. Your brand is what customers say about you after you deliver, outside of the company logo.
That’s fine when you’re building momentum. But at scale, competing on execution alone becomes unsustainable. You can’t out-hustle every competitor, nor can you be the cheapest without destroying margins.
You need small business growth strategies that are more defensible. But your business does not have systematic brand defenses in place. You’ve been focused on selling and delivering. Your brand has evolved organically, not strategically. That works until it’s time to push into a higher market. At that point, organic brand development becomes a liability.
This business transition happens gradually, then suddenly.

Here’s what I mean:
Sales cycles get longer because it takes more to convince buyers why you’re different. Close rates decline because your differentiation isn’t clear enough to justify prices. Marketing costs rise because you’re competing in increasingly commoditized channels.
By the time leadership recognizes these signs as symptoms of brand problems and not execution problems, you’re 12-18 months behind where you need to be.
This is why a strategic brand audit should come first—before you develop a small business growth strategy.
You cannot achieve higher growth levels until you know how your current brand is actually perceived in the market, how that perception has drifted from where you think it is, and what threats are eroding your market position before they show up in quarterly results.
A strategic brand audit will help you uncover and correct brand drift.
Your brand is taking shape in the market, whether you’re actively managing it or not. Competitors are positioning against you. Customers are forming perceptions. Analysts and reviewers are categorizing you.
The question is: Are you defining your brand strategically or letting market forces define it for you?
If you aren’t actively managing your brand positioning, then you’re letting it drift out into the sea of competitors. When that happens, customers guess at what you do and stay confused about your business.
A confused mind says “no.”
At your scale, you can no longer afford to let brand development happen organically or use guesswork for competitive positioning.
You need an intentional brand strategy that creates distance between you and competitors, clarity for buyers about why you’re the right choice, and defensibility that protects your margins and market position.
Why does an audit come first in small business growth strategies?
Most founders miss the connection to growth. Brand clarity accelerates growth, and brand confusion inhibits it.
When your brand strategy is clear and defensible, everything downstream gets easier and faster.
Sales cycles get shorter because buyers understand why you’re different. Close rates improve because your differentiation justifies your pricing. Marketing efficiency increases because you’re not competing on the generic benefits everyone else is. Customer acquisition costs decline because strong brands generate referrals and inbound demand. Expansion revenue grows because customers who understand your unique value buy more over time.
The opposite is also true. When your brand drifts or remains undefined, growth becomes expensive and fragile.
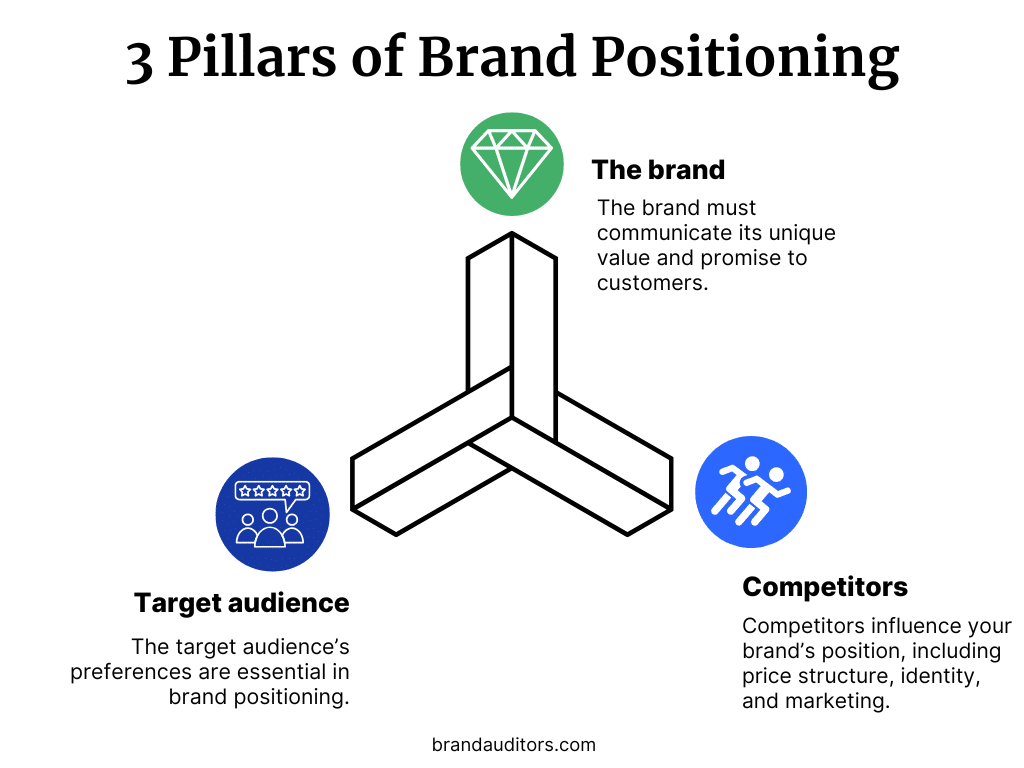
Most small businesses compensate for weak positioning with more sales activity, more marketing spend, more discounting, and more customer churn.
Revenue might grow, but at declining margins and increasing capital requirements.
That’s not scalable growth; it’s an expensive treadmill.
Successful small business growth strategies begin with clarity about the company’s market position, what it stands for, and why it matters to specific buyers.
The brand audit establishes that clarity. Once you have it, every other growth lever, such as marketing, sales, operations, and customer service, becomes more effective.
The rest of this guide shows you how to activate those levers. All of them rest on the foundation of knowing exactly where you stand in your market and where you need to go.
Defending your market position
You’ve already become successful in your market. Now, you must defend your position against aggressive competitors and resist the temptation to put profit margins at risk by expanding horizontally.
The niche market strategy could be the most reliable path to defending your position.
Business research shows that vertical specialists (niche specialists) command 23-40% price premiums over horizontal providers in business-to-business (B2B) markets. These premiums are driven by deeper expertise, custom workflows, and measurable business outcomes.
Buyers will pay more for proven expertise. Business-to-business (B2B) buyers want vendors who speak their language, understand their regulations, and have solved their exact use case dozens of times.
The same is true for business-to-consumer (B2C) brands. Consumers are willing to pay more for niche products and services, especially when those offerings deliver specialized value, have emotional resonance, or are culturally relevant.
Generalists compete on features and price. Specialists compete on outcomes and trust.
You must continue to defend your market position. Competitors study your successes and target your customers. Well-funded startups can copy your product or service features faster than you expect. Lower-cost entrants force profit margin decisions. Adjacent market innovations raise customer expectations.
Generalists compete on features and price. Specialists compete on outcomes and trust.
Define your market position by analyzing competitors
You can’t compete unless you know what—and who—you’re competing against.
Surface-level competitive awareness isn’t enough. You need a systematic analysis across six dimensions to reveal strategic patterns and opportunities:
Market positioning and messaging
In this first step of competitive analysis, you’ll look at how competitors describe their value, the problems they emphasize, and the proof they use to back up claims.
Study competitors’ website copy, case studies, and sales materials. Look for repeated language patterns to uncover their positioning strategy. Pay attention to what they talk about and don’t talk about. Omissions indicate weaknesses or missing capabilities.
If three competitors all emphasize speed and you emphasize accuracy, you’ve identified clear differentiation. If everyone claims the same benefits, you’re in a commoditized conversation.
Product and service comparison
What do competitors offer that you don’t, and vice versa? Where is feature parity assumed, and where does real differentiation exist?
In this step, you want to understand which capabilities matter to buyers and where you have defendable advantages.
Pricing strategy
How do competitors structure pricing? What’s included at each tier? How do they position value relative to price?
Pricing reveals strategic intent. Aggressive pricing indicates the company is attempting to capture market share rapidly. Premium pricing is a sign that a competitor is focused on differentiation claims. Frequent discounting reveals weak demand. Recent price increases show confidence and market power.
Go-to-market approach
Which channels do competitors use for customer acquisition? Where do they invest marketing dollars? What partnerships have they formed?
This information reveals where the competitive battleground is most intense and where opportunities exist.
Customer perception
What do customers say about competitors in reviews, forums, and social media?
Carefully read through negative reviews. They show what drives customers away and creates switching opportunities. Positive reviews help you understand what creates loyalty. Track review volume and sentiment trends over time.
Growth trajectory
Are competitors growing faster or slower than you? Have they raised capital recently?
Track their job postings. Engineering hiring indicates a product development focus. Executive hiring signals scaling challenges or strategic shifts.
Document this in a simple matrix. For your top 3-5 competitors, list their core strengths, primary vulnerabilities, and your competitive response strategy.
The goal isn’t to copy what competitors do. It’s to understand competitive dynamics well enough to make strategic decisions about where to invest, what to emphasize, and how to position your brand.

Wait for market leadership before expanding
The difference between horizontal expansion and vertical expansion lies in the direction a company chooses to grow within its industry’s value chain.
Here’s the difference:
- Horizontal expansion (Breadth) is to acquire more market share and sell more of what you already sell.
- Vertical Expansion (Depth) happens by gaining more control over your product’s quality, costs, and supply chain.
At the critical $5 million or more revenue level, there’s a strong temptation to expand horizontally because adjacent markets look easy to tap into.
However, horizontal expansion means you must spread capital, talent, and attention across multiple value propositions. Your competitive advantage weakens everywhere, including in your current market.
Here are four signs that you might be ready for expansion:
- The top 3 market share in your defined market is a sign of strong product-market fit, brand awareness, and operational maturity.
- More than 50% of inbound leads are from category-specific search and referrals. High-quality inbound signals brand clarity, organic demand, and reduced customer acquisition costs (CAC).
- Instead of following competitors, you’ve set pricing benchmarks. Pricing leadership reflects differentiated value and brand authority.
- Competitors position against you, not the other way around. When competitors define themselves in relation to your brand, it signals category leadership and strategic influence.
This approach leverages:
- Customer economics that have been validated.
- Operational playbooks that scale.
- Brand equity that transfers across segments.
First, hit these markers. Then, expand by cloning your model into adjacent niches with similar customer economics and buying behavior.
Don’t start from scratch in a new market. Scale by pattern recognition, not experimentation.
Sources for the recommendations above:
- Bessemer Venture Partners – Scaling from $1M to $10M ARR
- Forbes Business Council – Tactics for Small Businesses
- Monetizely – Vertical SaaS Pricing Premiums
- Brett Trainor – Why 99 out of 100 Businesses Never Reach $10M
Optimize marketing for capital efficiency
Your marketing budget is real money with real expectations for return. Yet many companies at the $5 million or higher annual revenue scale still run marketing like a startup. They experiment with everything, measure nothing useful, and spread the budget too thin.
Focus on three metrics that matter: cost per qualified lead, channel-specific win rates, and 12-month revenue per marketing dollar.
Many of our clients tell us they must be visible on a channel because “that’s where our competitors are.” While that may be true in some cases, we find that most of our clients’ competitors aren’t successful on those channels, which means following them is a mistake.
Content marketing as a competitive moat
Successful small business growth strategies should include content that demonstrates expertise. Examples of this content are proprietary research that only you are qualified to publish, benchmark reports with real data from your customer base, implementation frameworks from actual projects, and strategic guides that buyers can’t find anywhere else.
This content attracts potential customers before they go into active buying mode. Prospects find you through search, consume your content, and form opinions about your expertise before contacting sales or buying a product from your website.
A successful content marketing strategy shortens sales cycles through pre-education and supports premium pricing through demonstrated expertise.
Focus on developing content around specific customer problems and show how you can solve them using your expertise. Generic topics generate traffic without conversion, but niche topics generate a qualified sales pipeline.

Budget allocation at scale
In this section, we’ll take a look at a budget allocation model based on 2025 B2B marketing benchmarks for companies scaling demand generation, pipeline influence, and retention.
Each channel’s investment and payback target is within industry norms.
| Channel | Monthly Budget | Strategic Role | Verified Benchmark Alignment |
|---|---|---|---|
| Paid Search | $12K | Scale proven demand | Benchmarks show paid search often receives 25-30% of demand gen budget. It is standard for high-intent channels to target payback under 6 months. |
| Vertical Content & SEO | $8K | Build category leadership. | Channel marketing often receives 10-12% of the budget. A valid metric is partner-sourced ARR; 8-month payback is achievable. |
| Account-Based Marketing | $7K | Drive enterprise expansion | ABM spend ranges from 10-15% depending on ACV. 12-month payback aligns with long-cycle enterprise deals. |
| Strategic Partnerships | $6K | Generate channel revenue. | Videos/webinars often receive 5-8%. A common indirect ROI measure is sales cycle reduction. |
| Email & Automation | $4K | Drive expansion revenue | Email/automation typically gets 5-10%. Net revenue retention is a leading metric. 3-month payback is aggressive but feasible. |
| Video & Webinars | $3K | Product education | Video/webinars often receive 5-8%. A common indirect ROI measure is sales cycle reduction. |
This allocation reflects a balanced mix of acquisition, expansion, and enablement. It is especially well-suited for companies with:
- $5M-$20M annual revenue
- Annual contract value between $10K and $50K
- Multi-channel GTM strategies
The payback periods align with current expectations for pipeline velocity and retention ROI.
Notice the pattern. There’s heavy investment in proven demand capture, systematic investment in organic authority, and controlled spending on expansion channels. This is a strategic allocation approach based on documented performance.
You must review channel performance weekly using a unified data model connecting spend to closed revenue, not pipeline creation.
Sources for the recommendations above:
- Benchmarkit 2025 B2B Marketing Benchmarks
- Forrester B2B Budget Allocation Insights
- The B2B Labs: 2025 Marketing Metrics
Build a sales funnel that converts
A funnel filled with prospects who aren’t a good fit for the company’s product or service can’t be fixed by a talented sales team. They’ll work twice as hard to close half as many deals, burn out faster, and accept the blame for what is actually a targeting problem.
The solution starts with your sales funnel, which is the entire system from initial targeting to closed revenue.
Get this right, and sales execution improves dramatically. Get it wrong and even your best reps will struggle to close deals.

Supercharge the sales process with Ideal Customer Profiles (ICPs)
Most companies think they have an ideal customer profile (ICP), but what they actually have is a vague description like “mid-market companies in healthcare” or “homeowners over 40 years old.”
That’s not an ICP. It’s a market segment—and a vague one at that.
An in-depth ICP defines your ideal customer with operational precision that guides every targeting, qualification, and sales decision.
Here are some examples of data used to develop ICPs for your most profitable customers:
Firmographic criteria include industry, company size, revenue range, geographic location, growth stage, and technology stack.
Be specific. “Healthcare providers” is too broad. An ICP is “Ambulatory surgery centers with 3-8 locations, $15M-$60M in revenue, operating in states with specific compliance requirements.”
Behavioral signals are triggers that prompt people to start looking for a solution. Here are some examples:
- Struggling with regulatory changes
- Trouble achieving growth milestones
- Having technology failures
- In a leadership transition
- Being outperformed by competitors
When you know the trigger, you can target customers experiencing it.
Budget authority: It’s critical to target the person who holds purchasing power. You must also know their typical budget range.
For business-to-business brands, you should know their procurement process. Is it a single decision-maker or a committee? Do they require RFPs, vendor assessments, or legal review?
Decision timeline: Assess how urgent it is for the customer to solve their problem.
Are they in active evaluation mode or just exploring? What fiscal constraints or seasonal factors affect their buying timeline?
Pain tolerance and sophistication: How acute is the customer’s pain? Are they experiencing daily problems or looking for marginal improvements?
What’s their knowledge level? Do they know enough about your product or service to make a buying decision, or do they need extensive education to understand it?
Success patterns: Look at your best customers-the ones who were satisfied with the product, bought again or expanded usage, and referred others. What do they have in common? Those commonalities define your true ICP, not your aspirational one.
If you serve meaningfully different customer types, build 2-3 distinct ICPs. Focus on determining which one(s) drives the most profitable, efficient growth. That’s where you should concentrate resources.
A refined ICP improves conversion rates across your entire funnel. When you talk to the right buyers at the right time with the right problem, everything else gets easier.

Map and optimize your sales process (B2B) or conversion funnel (B2C)
Once you’re attracting the right prospects or customers, your customer journey process determines whether they buy from you. At your scale, you need to use a proven methodology that converts efficiently and scales predictably.
For B2B businesses with sales teams
Map your buyer journey with clear stage definitions, exit criteria, and required evidence at each stage: discovery, qualification, value alignment, commercial proposal, legal, and close. Each stage must have specific outcomes that must be achieved before advancing.
Discovery means understanding their current state, desired outcomes, key stakeholders, decision process, timeline, and budget reality. Exit criteria: You can articulate their business problem better than they can, and they’ve confirmed you understand it correctly.
Qualification means validating that they match your ICP, have a budget and authority, recognize the problem as urgent enough to solve now, and that your solution can deliver the outcomes they need. Exit criteria: mutual agreement that there’s a fit worth exploring, with specific next steps scheduled.
Value alignment means connecting your solution to their specific business outcomes with quantified impact. It does not mean features and benefits, but actual results expressed in their language with their metrics. The exit criteria are when the economic buyer confirms that the value justification works for their business case.
A commercial proposal means presenting pricing, terms, and implementation approach that align with their decision process and risk tolerance. Exit criteria: no surprises in the proposal, pricing is within the expected range, terms are acceptable, and the timeline is realistic.
Legal means working through contracts, security reviews, compliance requirements, and vendor onboarding. Exit criteria: all stakeholders have approved, contracts are executed, and the implementation kickoff is scheduled.
For B2C businesses with transactional models
Map your customer journey with clear stages and conversion optimization opportunities: awareness, consideration, evaluation, purchase, and post-purchase. Each stage has specific metrics and friction points to address.
Awareness means customers discover your brand through search, social, content, ads, or referrals. The key metrics are traffic sources, cost per click, impression share, and brand search volume. Optimization involves improving discoverability through SEO, paid acquisition efficiency, and brand-building content.
Consideration means customers are actively evaluating whether your product solves their need. Key metrics include time on site, pages per session, product page views, and add-to-cart rate. Optimization includes improving product content, photography, specifications, social proof (reviews, ratings, UGC), and comparison tools.
Evaluation means customers are deciding between your product and alternatives, or considering whether to buy at all. Key metrics include cart abandonment rate, exit pages, and price comparison behavior. Optimization involves addressing objections through guarantees, return policies, shipping transparency, customer service availability, and financing options.
Purchase means customers are completing checkout. Key metrics are checkout abandonment rate, payment success rate, and average order value. Optimization includes simplifying checkout flow, offering multiple payment options, displaying security badges, showing shipping costs upfront, and enabling guest checkout.
Post-purchase means customers receive and use the product. Key metrics include delivery satisfaction, return rate, first review timing, and repeat purchase rate. Optimization includes improving packaging experience, sending usage guidance, requesting reviews at optimal timing, and offering complementary products.
The principle is the same for both models: document what works, identify where prospects drop off, test improvements systematically, and scale what converts.
Train sales to sell outcomes, not features
Value is contextual, not feature-based. A feature that solves one customer’s problem might be irrelevant to another’s situation.
Require sales reps to use discovery frameworks that uncover the current state, the desired future state, the cost of maintaining the status quo, and the decision timeline before presenting any solution.
Connect your offerings to specific business outcomes: risk mitigation, revenue enablement, cost reduction, or compliance achievement. Quantify the impact. “Reduces compliance audit time by 40%” is more compelling than “automated audit workflows.”
Use systematic close processes that confirm decision-making authority, approval process, timeline, and success criteria at every stage. Establish clear next steps on every call.
Ambiguous endings kill deals because momentum dies, and competitors fill the vacuum.
Implement your CRM as a system of record
Your customer relationship management system (CRM) should provide complete visibility into sales operations, not just contact management. Define stage progression criteria, required data fields, and automated workflows that enforce your methodology.
Track leading indicators that predict performance, such as outreach velocity, meeting-to-opportunity conversion, stage progression rates, discount frequency, and competitive win/loss patterns.
These metrics reveal problems before they show up in revenue.
Systematically diagnose performance issues
When conversion rates decline, diagnose the root cause before applying solutions to symptoms.
Poor fit? Tighten the ICP criteria and qualification methodology. You might be attracting the wrong prospects or advancing poor fits too far into your funnel.
Weak proof? Add customer case studies with quantified outcomes that match your prospects’ situations.
Slow response? Speed matters. Responding in 2 hours instead of 24 hours often determines who wins the deal.
Price confusion? Simplify packaging and pricing communication. If buyers struggle to understand your pricing, they will default to cheaper or simpler alternatives.
Competitive loss? Strengthen differentiation and positioning. If you’re losing on price, you’re losing on value communication first.
Systematic improvement of conversion rates produces outsized returns compared to increasing top-of-funnel volume.
For example, if a win rate on 100 qualified opportunities improves from 40% to 45%, it generates 5 more deals. This is the equivalent of generating 12.5 additional qualified opportunities through marketing.
Fix your funnel before you scale it. Otherwise, you’re spending more money to generate the same disappointing results faster.
Scale business operations without breaking them
Two companies in the same industry have the same revenue and the same growth rate. One sells for 8x EBITDA (Earnings Before Interest, Taxes, and Amortization). The other sells for 4x.
The difference is operational maturity.
The 8x company had documented processes, automated workflows, clean data, and systems that could scale without the founder.
The 4x company ran on tribal knowledge, manual processes, and key person dependencies.
Both made money. Only one was investable.
Businesses should document every process, workflow, and system to the point where a qualified professional can execute it without direct training from the original creator. They should also map critical workflows showing how work moves, who touches it, decision points, approval requirements, and quality gates.
Build leadership
Founders and CEOs at the $5M+ annual revenue stage often wait too long to build the leadership team. They keep executing, selling, and delivering. Eventually, they end up being the bottleneck for every major decision in every important meeting, working 70-hour weeks.
Then, growth accelerates and everything breaks.
Founder-led execution models don’t scale. You need executives who can run entire functions without your daily involvement. Not senior individual contributors. Not managers who might grow into the role. Actual executives who have done this before.
- The VP of Sales is accountable for revenue attainment, sales methodology, team development, and pipeline predictability.
- The VP of Marketing drives demand generation, category positioning, customer acquisition economics, and brand strategy.
- The VP of Operations ensures service delivery, process excellence, quality metrics, and operational leverage.
- The VP of Customer Success owns retention, expansion revenue, product adoption, and customer health.
High-performing individual contributors rarely make effective first-time managers without support. The skills that made them successful (deep expertise, personal execution, and technical mastery) differ from leadership skills like delegation, coaching, strategic thinking, and team development.
Align compensation to outcomes
Executive compensation should reflect both foundational leadership and measurable business impact. A common approach is a base salary plus performance-based incentives, where the variable component is tied to outcomes that go beyond surface-level activity metrics.
Effective incentive structures focus on value-driving metrics rather than rewarding volume alone (i.e., leads generated, bookings made, or tasks completed):
- Not just initial sales activity, but revenue growth and retention.
- Not just lead volume, but also pipeline contribution and customer acquisition efficiency.
- Customer retention and expansion, not just satisfaction scores
- Operational leverage and margin improvement, not just delivery throughput.
This alignment ensures that executives are incentivized to drive sustainable, high-quality outcomes that support long-term growth and profitability.
Manage a small business today for enterprise value tomorrow
At $5 million+ revenue, financial management shifts from survival to optimization.
At this stage, you shift your focus to maximizing capital efficiency, defending margins, funding strategic initiatives, and building financial systems that can withstand investor or buyer scrutiny.
Revenue growth alone doesn’t drive valuation. Quality of earnings does. Investors look beyond top-line numbers to assess the strength, predictability, and scalability of your business.
Here are the KPI categories that matter most:
1. Growth efficiency
Track how effectively your company turns investment into profitable growth. This includes customer or client acquisition costs, payback periods, and overall return on marketing or sales spend. Efficient growth demonstrates financial discipline and strong unit economics.
2. Profitability & margins
Gross margin and contribution margin trends reveal how well your business controls costs and maintains pricing power. Consistent or improving margins show operational strength and scalability.
3. Customer or revenue retention
High repeat purchase or renewal rates confirm customer satisfaction and loyalty. Strong retention reduces dependency on costly new acquisition and signals stable recurring revenue potential.
4. Capital utilization
Healthy cash flow and declining general and administrative expenses as a percentage of revenue prove operating leverage — your ability to grow without proportionally increasing overhead. This shows your business can scale efficiently.
5. Revenue diversification
Avoid customer or channel concentration. A balanced revenue base reduces risk and strengthens your valuation multiple, where no single customer or source accounts for more than 10–20% of total income.
6. Margin stability over time
Investors favor businesses with stable or improving margins over multiple quarters. This signals that your model holds up as you grow, with a strong pricing strategy and cost management.
Sources:
- Wudpecker.io (2025 Retention Benchmarks): Top-performing B2B SaaS companies achieve NRR >120%, with a median of 106%. Larger firms ($100M+ ARR) report a median NRR of 115%, confirming that expansion revenue drives growth without new customer acquisition.
- GetMonetizely (2025): Tomasz Tunguz of Redpoint Ventures recommends a minimum LTV: CAC ratio of 3:1 for sustainable SaaS growth. Ratios below 1:1 are unsustainable, while 3:1 or higher signals efficient acquisition and strong profitability.
- Lighter Capital (2025): Industry benchmarks show the median CAC payback period for public SaaS companies is ~12 months, with shorter periods indicating stronger capital efficiency.
- CloudZero (2025): SaaS companies with gross margins ≥85% are considered highly efficient. Margins above 60% are typical for software-only models, while services often operate around 40% due to labor intensity.
- SaaS Capital (2025): The Rule of 40 remains a key benchmark for evaluating SaaS health. Companies exceeding 40% are considered attractive to investors and capable of scaling efficiently.
- Mobiloud (2025 Ecommerce Benchmarks): Repeat purchase rates vary by category, but consumables and beauty products can exceed 40% with strong retention strategies.
- Harvard Business School Online (2025): A ratio of 3:1 or higher is considered attractive and scalable for consumer businesses.
- Wall Street Prep (2024): Viable B2C startups target CAC payback periods under 12 months, with faster payback improving liquidity.
- Opensend (2025): E-commerce gross margins typically range from 40–80%, with digital goods and DTC brands often exceeding 65%.
- Corporate Finance Institute (2025): CMAM is calculated as revenue minus COGS and marketing expense. A margin above 20% indicates profitability after direct costs.
Quality of earnings
Strong financial performance isn’t just about how much you make. It’s also about how reliable, diversified, and sustainable those earnings are.
Revenue quality
Healthy revenue is predictable and diversified. Aim for balanced income streams rather than dependence on a few customers or short-term spikes. Multi-year contracts, steady recurring revenue, and genuine demand growth all demonstrate stability to investors.
Margin sustainability
Stable or improving margins show that your business model scales efficiently. As revenue grows, your operations should become leaner — with sales, marketing, and overhead spending representing a smaller percentage of total revenue.
Cash Reserves
Maintain 6–9 months of operating expenses in easily accessible reserves. This protects against payment delays, talent turnover, and market shifts. It gives you flexibility to make strategic moves without disruption.
Sources:
- Forbes Business Council (2025): Quality of Earnings (QoE) reports are increasingly used in M&A to validate financial health and justify valuation multiples. Buyers rely on QoE to assess the sustainability and reliability of earnings.
- The Precision Firm (2025): Distribution businesses with 30–60% recurring revenue earn 0.5x–1.5x EBITDA higher than peers. Buyers prioritize contract-backed revenue for its predictability.
- Bain & Company (2025): Sustainable profitable growth requires margin durability and efficient commercial investment.
- Accounting Insights (2025): Liquidity buffers are essential for financial stability and operational continuity.
Fund strategic growth
Invest capital where it creates lasting value, not just short-term gains. Prioritize initiatives that strengthen your product, improve customer retention, increase contract size, or make operations more efficient.
Start small. Test new investments through pilot programs with clear goals and 90-day review points. Scale only what proves profitable.
Focus on the core metrics that determine enterprise value:
- Revenue growth and retention: Grow through loyal customers, not just new ones.
- Customer economics: Keep acquisition costs efficient and returns high.
- Profitability: Maintain healthy margins to fund reinvestment.
- Revenue diversity: Avoid overreliance on a few customers or markets.
- Recurring revenue: Build predictable, repeatable income streams.
These priorities ensure every dollar you invest compounds over time, strengthening both short-term performance and long-term valuation.
Sources:
- SaaS Capital: How to Reduce Churn – Feature enhancements tied to customer success reduce churn and increase expansion revenue.
- OpenView Partners: ACV Expansion – Increasing ACV through upsell/cross-sell is a key driver of Net Revenue Retention.
- Wall Street Prep: CAC Payback Period – A payback under 12 months is a benchmark for scalable growth.
- SaaStr: CAC Payback and Growth Efficiency – Efficient marketing programs show CAC payback under 12 months and scale with volume.
- McKinsey: Automation ROI – Digital automation initiatives with payback under 18 months are prioritized for operational leverage.
- Harvard Business Review: Scaling Pilots – Pilots should be time-boxed with clear metrics and kill-or-scale decisions.
- Six Sigma Study Guide: Pilot Testing – 90-day pilots with defined success criteria reduce risk and improve implementation outcomes.
- Forbes: Revenue-Based Financing – Flexible, non-dilutive capital tied to revenue performance.
- Lighter Capital: Venture Debt vs. Equity – Venture debt extends runway between equity rounds.
- Brex: Choosing the Right Capital – Compares revenue-based financing, traditional debt, and equity for different growth scenarios.
- SaaS Capital: 2023 SaaS Benchmarks – NRR, CAC payback, and recurring revenue benchmarks.
- Aventis Advisors: SaaS Valuation Metrics – Rule of 40, gross margin, and revenue concentration impact on valuation.
- FE International: SaaS Exit Readiness – Key metrics that drive enterprise value and exit multiples.

Build expansion revenue by boosting customer retention
The cost of acquiring new customers is greater than the investment in increasing the value of existing customers.
According to Forbes Business Council, “Depending on the industry you are in, acquiring a new customer can cost five to seven times more than retaining an old one.”
This is especially true in Software as a Service (SaaS) and e-commerce, where retention strategies significantly reduce acquisition costs.
These findings show how important customer retention is in driving profitability and capital efficiency. Yet most companies focus primarily on new customer acquisition.
At scale, existing customers should fund your growth. While new customer acquisition becomes more expensive, expansion from or repeat business with existing customers becomes more profitable.
Customer insights that drive strategy
Your customer insights become the guideposts of strategic decisions. They systematically guide your product roadmap, shape competitive positioning, and validate market expansion opportunities.
Gaining strategic B2B customer intelligence
Systematically gather customer intelligence through quarterly business reviews with your top 20% of customers. Focus on achieved outcomes and strategic alignment.
Then, conduct structured win/loss analysis on every deal above $50K to identify key decision factors. Interview churned customers within 7 days of departure to understand root causes. Perform monthly cohort analysis to uncover adoption patterns and identify expansion opportunities early.
Customer insights in business-to-consumer (B2C)
Build systematic customer feedback loops that drive strategy:
1. Survey the post-purchase experience within 48 hours and track satisfaction metrics by shared customer characteristics (cohort analysis).
2. Conduct quarterly interviews with your top 20% highest-lifetime value (LTV) customers to understand what drives their loyalty and repeat purchases.
3. Run monthly churn analysis segmented by product type, acquisition channel, and initial purchase value.
4. Monitor product reviews and social mentions daily, categorizing both positive drivers and friction points.
This feedback cycle should directly inform your product roadmap, competitive positioning, and go-to-market strategy. It’s strategic intelligence, not just customer service data.
Execute with strategic intent
Once your business passes $5 million in revenue, growth depends on strategic discipline. This means making deliberate choices that strengthen your competitive advantage and long-term value.
Define your strategic framework
Clarify three decisions that guide every move:
- Growth target: Grow at a pace that maintains healthy margins and capital efficiency.
- Market positioning: Focus where you can win. Don’t chase markets that dilute your advantage.
- Capability investment: Build the right people, systems, and processes to support sustainable growth.
This framework simplifies complex decisions and keeps your team aligned.
Align strategy with exit objectives
Whether you’re aiming for acquisition or long-term independence, align your strategy early:
- For private equity or investors: Prioritize recurring revenue, margin expansion, and operational self-sufficiency.
- For acquisition: Strengthen market leadership, defensible IP, and category dominance.
Track what predicts success
Focus on metrics that reflect quality, not just scale. Examples are customer retention, margin improvement, acquisition efficiency, and productivity. These indicators reveal whether your growth is sustainable.
Review strategy quarterly
At this stage, annual planning isn’t enough. Revisit your strategy every quarter to adjust for market shifts, customer behavior changes, and margin trends before they affect performance.
Invest in artificial intelligence (AI)
AI adoption creates operational leverage that compounds into a competitive advantage. The companies implementing AI effectively now will operate with 20-30% better efficiency within 12 months—lower costs, faster response times, and leaner teams.
Where to apply AI immediately:
AI handles repetitive work at scale. Customer support automation answers common inquiries 24/7. Data analysis tools surface churn risks and expansion opportunities from thousands of customer interactions. Content generation accelerates marketing and sales output. Sales intelligence analyzes calls to identify winning patterns and prioritize high-value leads.
These are proven tools that deliver measurable ROI within 90 days.
Why timing matters:
Your competitors are implementing AI right now. The ones who move first compound efficiency gains quarterly, while others fall behind. The window for “wait and see” has closed. AI has moved from experimental to essential.
Start with three high-impact areas:
First, implement AI customer support for common inquiries, which typically pays back in 60-90 days. Second, deploy AI for customer data analysis to identify revenue opportunities. Third, use AI to accelerate high-volume content needs, freeing your team for strategic work.
Don’t implement everywhere at once. Start with the highest-impact, lowest-complexity use cases. Learn what works. Then expand systematically. The companies that win at your scale will effectively augment their teams with AI, creating leverage that pure headcount can’t match.

Re-engineering your path to defensible growth
The most common structural failures that sink companies that make over $10 million annually are competitive erosion, scaling complexity, and margin compression.
Often, these issues are misdiagnosed.
Leaders attribute these challenges to market shifts or execution gaps, when the real problem is a failure of strategic consistency.
You’ve built a machine that works. To achieve sustainable growth, you need to stop running the machine and start re-engineering its blueprints.
Here, the failure of commitment and consistency manifests at the executive level: not in daily tasks, but in the systematic, disciplined adherence to the three pillars of defensible growth we discussed:
1. Validating your positioning each quarter.
2. Building operational capacity ahead of volume.
3. Tracking quality of earnings over revenue size.
When these structural disciplines are abandoned (i.e., the quarterly audit, delaying the operational redesign, or chasing vanity metrics), structural failures are inevitable. The lack of commitment to the new standard is the behavioral mechanism that undermines the defensible strategy.
You have the roadmap and the talent. What is often missing is the objective, third-party diagnostic to enforce the required strategic pivot and commitment.
That’s where The Brand Auditors comes in. We provide you and your team with diagnostic work that:
- Validates unit economics by customer segment.
- Gives you an objective view of your true competitive position (not the aspirational one).
- Prioritizes an action plan to close your enterprise value gaps before growth forces your hand.
At your scale, growth is a choice between expensive chaos and defensible profitability. Choose the latter.
